 Details
Last year, at Native Advertising Days in Copenhagen, Brand Metrics presented a paper entitled “Did Your Last Campaign Work? Uncovering Native Advertising’s Secret Potential”.
This paper explored findings from measuring brand lift across 2,000 native campaigns and responses from over 500k surveys. That is a lot of data.
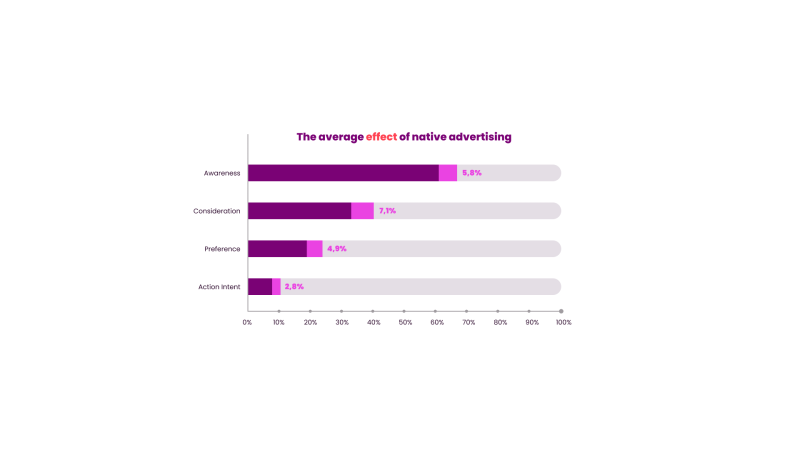
The data highlights key differences between display and native campaigns in terms of their impact on brand perceptions.
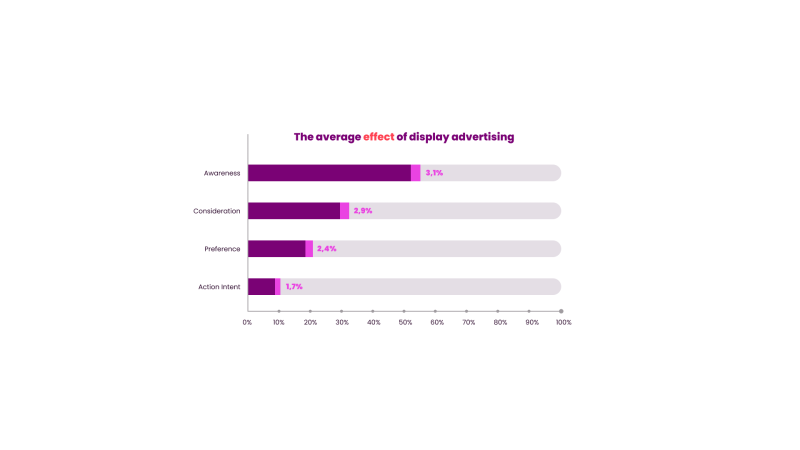
The data shows that, on average, native campaigns had a brand lift of +20.6%, compared to +10% for display campaigns. This reinforces the importance of “pull campaigns” in communicating with people more likely to have an interest in the category or brand.
But while this is a positive picture, the real insight comes from digging deeper and exploring the ingredients behind successful native and branded content campaigns.
Which metric does Native Advertising affect the strongest?
At Brand Metrics we consistently measure four metrics for every campaign – awareness, consideration, preference and action intent – but which metric(s) is most likely to be impacted by native campaigns?
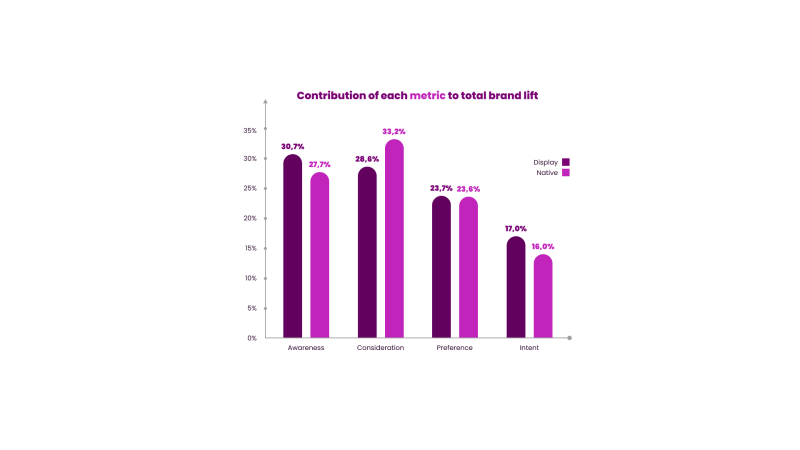
This chart shows the average “contribution” to total brand lift results made by each metric. For example, awareness contributes 30.7% of total brand lift for display campaigns.
This data illustrates how display campaigns contribute a greater proportion of brand lift at either end of the funnel (awareness and action intent), pushing an unfamiliar brand to a wider audience and then encouraging a particular action.
Native advertising can influence all four metrics, but the sweet spot is the consideration metric, contributing 33% of all native brand lift.
That is not surprising, since native advertising is an ideal channel for reaching those who are aware of the brand, but need more reasons to consider it.
How does consideration lift vary by industry category?
So, if native advertising has a strong effect on consideration, how does that vary by industry category? Are certain industries more open to native advertising messages?
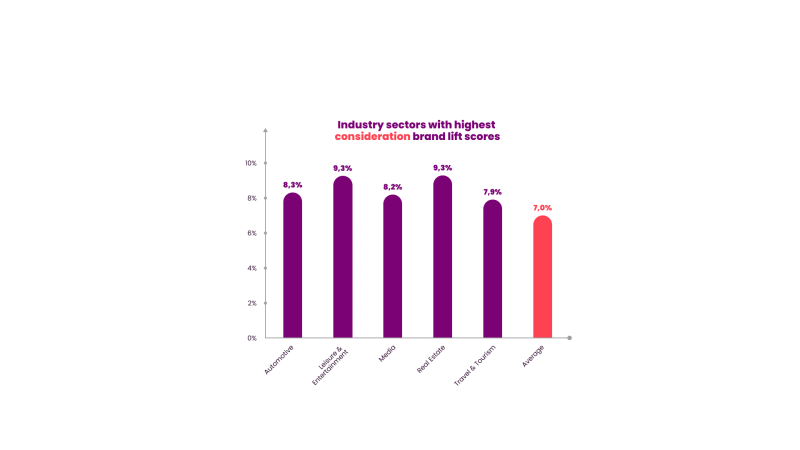
Our benchmarks measure native advertising campaigns across 19 major industry sectors, with an average consideration brand lift score of +7.0%. The chart above shows the sectors with the highest average consideration brand lift scores.
What if we were to drill down further? Within those industry sectors, our benchmarks cover 122 industry categories, with the chart below showing the highest scoring categories.
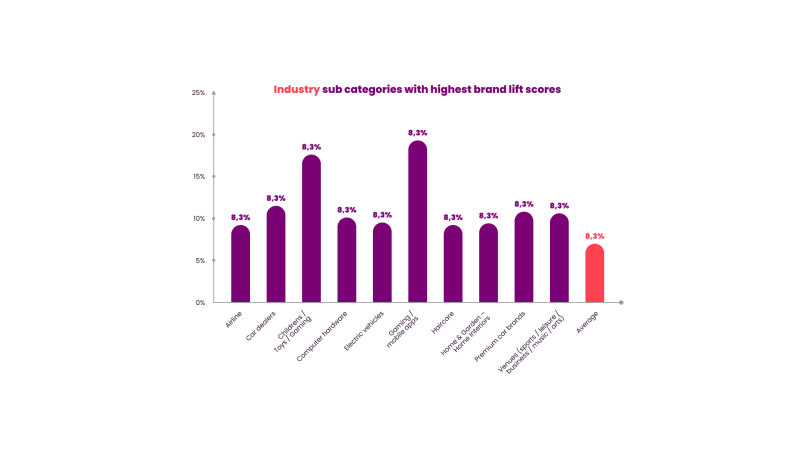
These categories are diverse, but generally exist across high engagement industries, where people are often open to receiving information from brands.
How is Native Advertising affected by seasonality?
So, what else can we learn from the data? What about seasonality? Do native campaigns work better at certain times of the year?
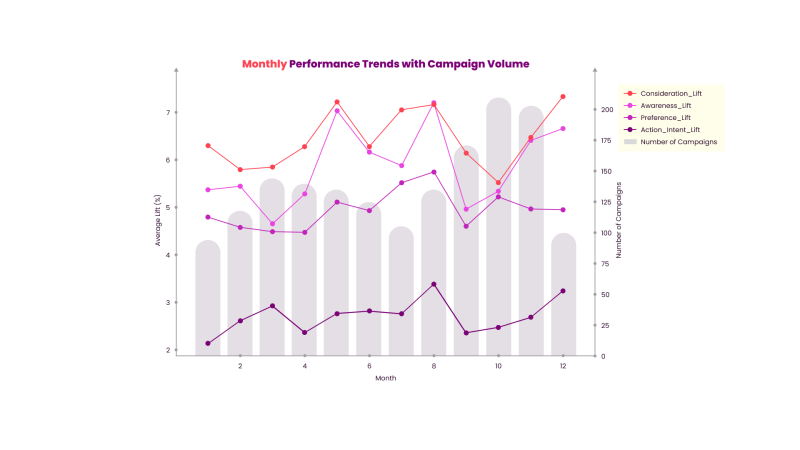
This chart shows how the average levels of brand lift fluctuate across the year.
Spring, late summer/early autumn and midwinter/Christmas are three periods of the year that typically deliver higher brand lift outcomes for native advertising across most metrics.
But within this, the patterns can vary by product category.

This chart shows the lifts in consideration across the top 5 categories and highlights different seasonal patterns. For instance:
Consideration lifts for car brands are highest in Q1 and Q3, which often coincides with new car model release dates and may therefore be when potential car buyers are open to car-related messages that may influence their potential consideration set.
Banks are highest in Q3, perhaps after the summer break, when people may be re-considering their finances in line with moving, starting a new job or another lifestyle change.
The health category sees the highest levels of consideration lift in the first half of the year, perhaps linked to personal New Year resolutions and the arrival of spring.
There may also be other valid hypotheses, but understanding these patterns can identify the most effective times of year to support brands via native campaigns.
Does brand size influence Native Advertising effectiveness?
Does native advertising work better for larger brands or smaller brands?
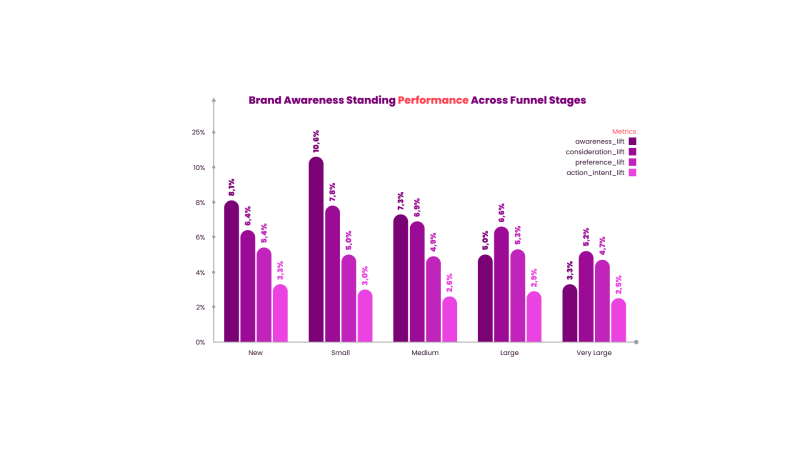
This chart shows the average brand lift for native campaigns, broken down by the size of the brand (defined by their brand awareness levels)
The data shows that for large/very large brands (>70% awareness) it is harder to achieve incremental gains in awareness, so they should focus on mid-funnel metrics, leveraging existing brand equity to drive consideration and preference. They should target modest, but consistent lift metrics (3-5% range)
For medium brands (40-70% awareness), they should seek to balance awareness building with lower funnel metrics and expect moderate lift potential (5-8% range)
For small and new brands (<40% awareness), they should prioritize upper funnel campaigns and set aggressive awareness targets (potential for 10%+ lift)
Recognising the growth potential for different sizes of brands can help to shape both initial briefs and also help establish achievable expectations for the campaign.
What have we learned about what makes a successful Native Advertising campaign?
Native advertising can work highly effectively across all metrics, but digging deeper reveals useful insights into the ingredients of successful campaigns:
- Objectives - target advertiser briefs seeking to drive consideration, where native advertising’s way of actively engaging audiences can have a significant effect.
- Categories - identify high engagement categories where people want to find out more information, enabling native campaigns to play to their strengths
- Seasonality - recognise category behaviour trends that influence seasonality and indicate where native campaigns can best engage potential customers
- Expectations - differentiate by brand size to determine what metrics and levels of brand lift are most likely to be delivered by a strong native campaign.
Hear more from Brand Metrics at Branded Content Days 2025 in New York where CEO Anders Lithner will be presenting further insights from our database.